Showing posts with label PowerAutomate. Show all posts

Tuesday, March 21, 2023

Exporting Log Analytics Logs with Logic App or Power Automate

For many years, all my PowerShell scripts kept a log of all their actions in a local file stored in the same folder where they ran, or in a file share so my colleagues could access the logs for troubleshooting. Nowadays, with some of those scripts running in Azure Automation, this is not really an option.


Some of these scripts in Azure Automation that don’t run too often, keep a monthly log in a SharePoint Online library. When they run, they download their current month’s log file locally (this is done using the Temp folder, $env:TEMP, which provides 1GB of temporary disk space while the runbook runs), do whatever they need to do while at the same time logging their actions against the local copy of the log file, and, once complete, upload the new log file to SharePoint overwriting the existing log.


However, for scripts that run very frequently, this might not be a suitable solution. For these, I tend to use a Log Analytics workspace where I log all the scripts’ actions. This is a great way to store logs because:

  1. It’s easy to write log entries in it;
  2. It’s easy to run queries against these logs using Kusto Query Language (KQL);
  3. We can retain the logs at no charge for up to 31 days (or 90 days if Microsoft Sentinel is enabled on the workspace), and with the Basic Logs we only pay £0.524 per GB in terms of ingestion;
  4. It’s easy to give my colleagues access to the logs.


For one particular solution I have, some of the users don’t have access to Log Analytics and wouldn’t really know how to use it if they did. As such, I started thinking about how to export these logs into CSV format so they could easily analyse them if needed. My first thought was to use another PowerShell runbook that would export these logs weekly or even monthly. If it’s easy to ingest logs into Log Analytics using its API, exporting them can’t be that hard. But then, why not use Power Automate or a Logic App to do this? It should be quicker to implement and, hopefully, less prone to issues/failures. After some research, I found the Azure Monitor Logs connector, which allows us to build workflows that retrieve data from a Log Analytics workspace or an Application Insights application in Azure Monitor!


This Azure Monitor Logs connector replaces the Azure Log Analytics connector and the Azure Application Insights connector. It provides the same functionality as the others and is now the recommended connector for these queries.


Connector Limits

Before we start configuring our workflow, it’s important to keep in mind the following connector limits:

  • Max query response size: ~16.7 MB (16 MiB);
  • Max number of records: 500,000;
  • Max connector timeout: 110 seconds;
  • Max query timeout: 100 seconds;
  • Visualisations in the Logs page and the connector use different charting libraries and some functionality isn't available in the connector currently.


The connector may reach these limits depending on the query you use and the size of the results. If that happens, you must adjust the workflow recurrence to run more frequently and/or with a smaller time range.


Actions

As to the connector actions, it can perform two things:

  • Run query and list results returns each row as its own object. We can use this action when we want to work with each row separately, or when we want to export the logs to CSV format, for example. This is the one I will be using;
  • Run query and visualize results returns an HTML table, a pie chart, time chart, or a bar chart depicting the query result set.


Logic App

First, we need to define our trigger. In my case, I will be exporting the logs once a week. As such, under, Start with a common trigger, I select Recurrence:


As I will be running this workflow every Monday morning at 7:00, I configure my trigger like this:


Since I want to search and export Log Analytics logs for the past 7 days, I create two variables that define the start and end of my search. The start will be last Monday (inclusive, meaning >=) and the end will be when the workflow runs, which is also a Monday (but this time, excluding the current day, or <). Each variable is defined as follows:

  • SearchStart: formatDateTime(addDays(utcNow(), -7), 'MM/dd/yyyy')
  • SearchEnd: formatDateTime(utcNow(), 'MM/dd/yyyy')


Every time I create a new Power Automate flow or Logic App workflow, I like testing every step as I go along creating them. I believe this makes it easier to ensure everything works as expected and reduce the time troubleshooting any possible issues down the line. So, let’s see what we have so far:


As we can see, SearchStart is the Monday from one week ago, and SearchEnd is today, also a Monday. All good so far!


Next, we click on + New step, search for the Azure Monitor Logs action, and select Run query and list results:


We need to select the Subscription, Resource Group, Resource Type, and Resource Name for our Log Analytics workspace. As to the search query, I will be using the query below that searches the logs using the two variables we created earlier. Notice the >= and < used in the search, which allow us to search from Monday to Monday without duplicating results during each export.

As to Time Range, we need to set this to a value equal or higher than the amount of time we are searching our logs. In this example, I am searching for 7 days’ worth of logs, so I could set this to Last 8 days. However, because we are defining our time range in the query itself, we can simply set this to Set in query.

GlobalRelay_CL

| where DateTime_t >= datetime(@{variables('SearchStart')}) and DateTime_t < datetime(@{variables('SearchEnd')})

| sort by DateTime_t desc

| project DateTime_t, Type_s, Message


If we run our workflow at this stage, we can see that the query is correctly using our SearchStart and SearchEnd variables, and that we are getting log entries returned from Log Analytics!   ðŸ˜Š


Now that we have our results, we use the Data Operations action to take the output from our search and create a CSV table:


The From is our data source which, in this case, is the value that gets passed from the Run query and list results action, so that’s what I select. As for Columns, we can leave it to Automatic as I don’t need to map them to a different column name for example.


If we test this step, we should see the log entries that we retrieved from Log Analytics previously, now in a CSV format instead of JSON:


Our final action is to save this data into an actual CSV file. In my case, this will be stored in a SharePoint library, so I search for the Create file SharePoint action:


Next, I specify the Site Address that will store the file, the Folder Path, the File Name, and the File Content. For the file name, I am using the following expression to dynamically generate a name based on the last date of logs the file contains, which is yesterday (Sunday). For the current example, the file will be named “LogExtract_20230319.csv”.

concat('LogExtract_', string(formatDateTime(addDays(utcNow(), -1), 'yyyyMMdd')), '.csv')


Lastly, the File Content is simply the Output from our Create CSV table action, so that’s what we select from Dynamic content:


Running a final test, we can see that the file was successfully created!


If I check our SharePoint library, the file is there with all the data I expected   ðŸ˜Š


Error Checking

The workflow seems to work great, but it’s always good practice to include error-checking for any actions that might fail. For example, what if the workflow fails to retrieve the entries from Log Analytics for some reason? To account for this, we can go to our Run query and list results action, and add a parallel branch:


In this new branch, I will send myself an email stating the export has failed. This is just a basic example, and you should include as many details as possible regarding the error itself, the stage at which the workflow failed, etc.


The only thing left to do is to ensure this branch only runs in case of a failure. To do that, we click on the “...” next to our action title, select Configure run after, unselect is successful, and select has timed out and has failed:

Thursday, March 2, 2023

Trigger Power Automate Flow from a PowerShell script to send an email alert

Proper error checking, logging, and alerting are essential for any production script. In terms of alerting, whenever my PowerShell scripts fail to perform a certain task, they send me an email alert with the failure error message. I typically do this through a Try/Catch block: I put whatever I need to make sure gets executed successfully inside the Try statement and, if that fails to run for whatever reason, I use the Send-MgUserMail Microsoft Graph PowerShell SDK cmdlet inside the Catch statement to send me the $_.Exception or $_.Exception.Message information related to the cause of the failure.

When my scripts run on-premises, they also use an on-premises Exchange server to send the email alert if the Send-MgUserMail cmdlet fails. However, not all environments have an on-prem Exchange presence (or a separate non-Microsoft method of sending emails). Furthermore, connectivity to on-prem might not even be an option if the script is running in Azure Automation for example (if not running in Hybrid Worker mode, of course).

For these scenarios, what I tend to do is use either a Power Automate Flow or an Azure Logic App that gets triggered by an HTTP request sent by the script which, in turn, sends the email alert.


One thing to keep in mind with Power Automate is that a cloud flow that has no successful triggers will expire and be turned off after 90 days of inactivity (the creator and co-owners are notified by email). This applies when the following licenses are used: 90 days for Free, Trial, Community, and Microsoft 365 Plans. As such, you might want to consider using either an Azure Log Apps, or purchasing a standalone Power Automate license to ensure your flow is not turned off due to inactivity.


Creating the flow

To start, we must first define our trigger. In this case, we use the When an HTTP request is received trigger which, unfortunately, is a premium connector:


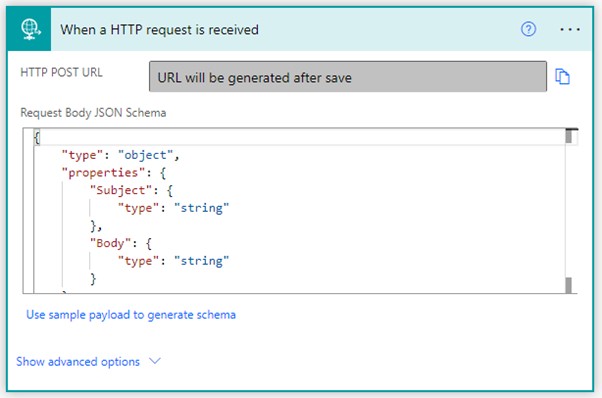
As you can see from the screenshot below, the URL is only generated once we save the flow, which we will do shortly. First, we need to define the JSON schema, which will tell the trigger what our POST request will include:


The easiest way is to click on Use sample payload to generate schema and provide an example of what we will be sending in our HTTP POST request. For this example, I will be sending the email alert subject and body so the flow can use that data in the email it will be sending. To do this, I provide a sample JSON payload as follows (in the name/value pair, only the name is important here):


As my alerts are always sent only to me, I am not specifying a recipient. However, if you want to use this flow to send emails to different recipients, you can easily add another field for this by regenerating the JSON schema like we just did. Once we click Done, Power Automate generates our body JSON schema for us:


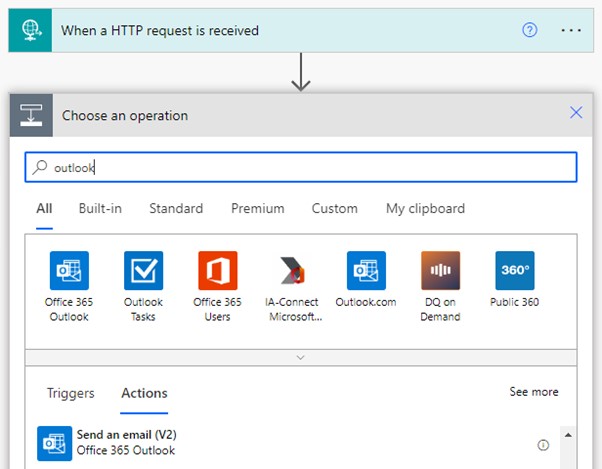
Next, we search for the Send an email (V2) action so we can send our email. Here, I am using Office 365 Outlook connector as I am using Exchange Online in an enterprise environment. You can obviously use any other connector, such as Gmail or Outlook.com for example.


After defining who the email will be sent to, as soon as we click on the Subject field, the popup box on the right comes up and we can immediately see the Subject and Body dynamic outputs from our previous step (our trigger). These “variables”, which we defined in our schema, will contain whatever we send in the HTTP POST request, assuming the request is correct and includes these fields.


We add each one to its correct place, configure any other options we want for our email, like Importance, and we are done:


Once we save our flow, the URL gets generated, and we can retrieve it:


Testing the flow

We are now ready to test our flow. Since it will be triggered by a normal HTTP POST request, there are many methods we can use. A very popular one is cURL. Since I primarily use PowerShell, let’s see how we can trigger this flow using a native PowerShell method. For this, we have two options (besides the old school .Net objects, like System.Net.WebClient): Invoke-WebRequest and Invoke-RestMethod.

Without going into much detail, Invoke-WebRequest is better at dealing with straight HTML results, while Invoke-RestMethod is much better at dealing with XML and JSON results (it automatically turns XML/JSON responses into PowerShell objects for example).

To keep things simple for this test, let’s do the following:

  1. Save the flow’s URL in a variable called $URL;
  2. Generate our JSON payload with the email subject and body, and save it in a variable called $postBody. The body supports HTML, so we can highly customise our email;
  3. Use Invoke-RestMethod to send an HTTP POST request to our flow URL with our JSON payload. It is crucial that you set the ContentType parameter to application/json, otherwise it will not work.


Obviously, you should add error checking for the Invoke-RestMethod call, but I am trying to keep it simple for testing purposes.


If all is working as expected, we should receive the email with the correct subject and body as per our JSON. If the POST request does not have the correct fields in the JSON payload, an email will still be sent, but it will likely be blank, depending on if any of the fields were included in the request.


As an additional security measure, I like to add another field to my request, a Secret:


I use this secret like an authentication mechanism: if the POST request does not provide the correct secret, the flow will either not do anything, or send me an email saying that someone else is trying to use it.

For this scenario, where the email is only sent to me anyway, this does not bring much benefit. But if emails are sent to other users, you don’t want them to be a victim of a phishing attempt because you did not secure the URL of your flow. Remember that anyone that knows the URL will be able to trigger the flow! Obviously, in this case, they would also need to know the fields being used, but it is always good practice to limit the exposure and reduce the risk.

To do this check, I added a Condition step that checks if the Secret output from the POST request matches the actual secret:


In the end, the flow looks like this:


Wednesday, August 3, 2022

Monitoring Azure AD Connect Sync times using Power Automate

For hybrid/federated environments, Azure AD Connect is a crucial service. Azure AD Connect Health provides invaluable information such as alerts, performance monitoring, usage analytics, and other information, but sometimes we need some flexibility on what gets alerted, how, and when.

By default, Azure AD Connect performs a delta sync every 30 minutes. However, what if something happens and it hasn’t been able to perform a sync for 5h? For large organisations, this can be a huge issue as it will impact a variety of services, such as the onboarding of new staff, changes made to groups, changes made to Office 365 services, etc.

In this post, I will show a way of using Graph API to monitor the time Azure AD Connect last performed a sync so we can get an alert when this goes above a specified threshold.

Since we are using Graph API, you will need an Azure App Registration with Organization.Read.All application permissions (check here for other permissions that also work). Once we have our app registration in place, we use the get organization method to retrieve the properties and relationships of the currently authenticated organisation.

If you want to use PowerShell, this is extremely easy with the new SDK. All you have to do is run the following (simplified for brevity reasons):

Import-Module Microsoft.Graph.Identity.DirectoryManagement

Connect-MgGraph

(Get-MgOrganization -OrganizationId "xxxxx-xxxx-xxxxx” -Property OnPremisesLastSyncDateTime).OnPremisesLastSyncDateTime


In this post, however, I’m going to show how to do this, including the alerting, using Power Automate. The first step, after creating a new flow of course, is to schedule it to run at a frequency we desire. In my case, I am running it every 2h because I want to be alerted whenever a sync hasn’t happened in over 2h:


Next, we need to be able to query Graph API, and for that, we need an OAuth token. There are multiple ways of doing this in Power Automate, so feel free to use whatever method you prefer if you already have one. For the method I have been using lately, first we need to initialise three variables that will contain our Azure tenant ID, the ID of our Azure app registration, and its secret:


Now we send an HTTP POST request to https://login.microsoftonline.com/$TenantID/oauth2/token in order to retrieve our token. In the request, we need to pass our app registration details. Again, there are multiple ways to achieve the same, below is the method I’ve been using:


If all goes well, we should now have a valid OAuth token that we can use to query Graph API. Save your flow, test it, and make sure you don’t get any errors. You should see the following in the run history: a status code of 200, and the token details in the OUTPUTS section.


Now that we know our flow works successfully in retrieving an OAuth token, we create a new step where we parse the JSON that gets returned by the previous step. This is because we only need the access_token information (listed at the bottom of the previous screenshot). To do this, we use the Parse JSON action of the Data Operation connector. Under Content, we use the Body from the previous step, and under Schema, you can use the following:

{
    "type": "object",
    "properties": {
        "token_type": {
            "type": "string"
        },
        "expires_in": {
            "type": "string"
        },
        "ext_expires_in": {
            "type": "string"
        },
        "expires_on": {
            "type": "string"
        },
        "not_before": {
            "type": "string"
        },
        "resource": {
            "type": "string"
        },
        "access_token": {
            "type": "string"
        }
    }
}


We can now retrieve the information we want! At the most basic level, we issue a GET request to the following URL: https://graph.microsoft.com/v1.0/organization/our_tenant_id

However, this will return a lot of information we don’t need, so we ask only for the onPremisesLastSyncDateTime by using $select:


Like before, we need to parse the JSON that gets returned so we can more easily use the information retrieved:


For the Schema, you can use Graph Explorer to run the same GET request. Then, copy the Response preview and use it as your sample in Generate from sample.


 That will generate the following Schema you can use to parse the JSON:

{
    "type": "object",
    "properties": {
        "@@odata.context": {
            "type": "string"
        },
        "onPremisesLastSyncDateTime": {
            "type": "string"
        }
    }
}


We now have all the information we need. I suggest you test your flow once more to make sure everything is working as expected. If it is, you should get the following:


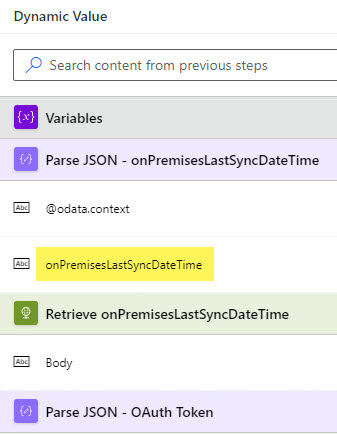
Although INPUTS and OUTPUTS seem identical, by parsing the JSON we now have an onPremisesLastSyncDateTime dynamic property we can use in our flow, something we don’t get without parsing the JSON:


The next step is to check when the last sync happened. Keeping in mind that the returned date/time is in UTC format, we can use the following formula to check if onPremisesLastSyncDateTime is less than (aka older) the current UTC time minus 2h. If it is, then we know the last successful sync happened over 2h ago and we send an alert.

Simply copy-paste the following formula in the first field of you Condition (unfortunately it’s no longer possible to edit conditions in advanced mode):

less(body('Parse_JSON_-_onPremisesLastSyncDateTime')?['onPremisesLastSyncDateTime'],
addminutes(utcnow(), -120))


If the result is no, then a sync happened less than 2h ago, so we can successfully terminate the flow. Otherwise, we can send a Teams notification (or email, or whatever method you prefer):


 In this example, I am posting a Teams message to a group chat. For some reason, Power Automate keeps adding unnecessary HTML code even when I write the code myself… Here is the code I am using:


<p>Last Azure AD Connect Sync was <span style="color: rgb(226,80,65)"><strong>@{div(sub(ticks(utcNow()),ticks(body('Parse_JSON_-_onPremisesLastSyncDateTime')?['onPremisesLastSyncDateTime'])),600000000)}</strong></span> minutes / <span style="color: rgb(226,80,65)"><strong>@{ div(sub(ticks(utcNow()),ticks(body('Parse_JSON_-_onPremisesLastSyncDateTime')?['onPremisesLastSyncDateTime'])),36000000000)}</strong></span> hours ago (@{body('Parse_JSON')?['onPremisesLastSyncDateTime']} UTC)!</p>


This code produces the following message:


But what are those two weird formulas? That’s how we calculate the difference between two dates and times:

div(sub(ticks(utcNow()),ticks(body('Parse_JSON_-_onPremisesLastSyncDateTime')?['onPremisesLastSyncDateTime'])),600000000)


First, we get the current date/time in ticks by using utcNow():

ticks(utcNow())


A tick is a 100-nanosecond interval. By converting a date/time to ticks, we get the number of 100-nanosecond intervals since January 1, 0001 00:00:00 (midnight). By doing this, we can easily calculate the difference between two dates/times. Might sound a bit strange, but a lot of programming languages use ticks.

Then, we subtract the number of ticks for our onPremisesLastSyncDateTime property, which tells us how many ticks it has been since the last sync:

sub(ticks(utcNow()),ticks(body('Parse_JSON_-_onPremisesLastSyncDateTime')?['onPremisesLastSyncDateTime']))


Lastly, because we don’t want the result in ticks but in minutes or hours, we divide the result by 864000000000 so we get the time difference in minutes, or by 36000000000 to get the result in hours.


And there you have it! Now, whenever Azure AD Connect takes over 2h to perform a sync, you will be notified!   😊