Showing posts with label Monitoring. Show all posts

Thursday, December 1, 2016

Exchange Alerts using Microsoft Teams

Back in September I wrote the Exchange Monitoring Concerns? Pick Up the Slack article for TechGenix (later posted in my blog as Exchange alerting using Slack) about monitoring Exchange and sending mobile alerts to administrators using Slack, a messaging app for teams. At the time, Slack was one of the best apps I could find to easily generate alerts on mobile devices.

A few weeks ago, Microsoft announced Microsoft Teams, a competitor to Slack. From my short experience with it, Microsoft Teams seems to work great, especially since it’s fully integrated with the rest of the Office 365 suite. To learn more about Microsoft Teams, please watch this Microsoft Mechanics video.

The question now is: can we use Microsoft Teams to alert administrators on their mobile devices when something is wrong with their systems or application (such as Exchange)? Let’s find out!

Signing Up to Microsoft Teams
At the time of writing this article, Microsoft Teams is available in preview (since November 2, 2016) to eligible Office 365 commercial customers (Business Essentials, Business Premium, and Enterprise E1, E3, E4 and E5). It is expected the service will become generally available in the first quarter of calendar year 2017.

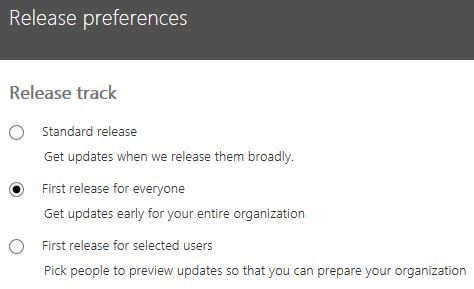
To turn on Microsoft Teams, IT admins should go to their Office 365 admin center, click Settings, click Organization profile and scroll down to Release preferences. In here, ensure preview features are enabled:
 
Now click on Apps:

On the list of available apps, search for Microsoft Teams and enable the service, plus all the required features you want to use:
 

Accessing Microsoft Teams
For some reason, after enabling Microsoft Teams, its icon is still not available in the app launcher:

However, if we navigate to https://teams.microsoft.com we will be able to login to the service just fine.

Similar to Slack, and many other Office 365 applications, Microsoft Team is available in three versions: web app, desktop app, and mobile app.

The purpose of this blog post is not to explain how to use Microsoft Teams (the Microsoft Mechanics video is a great place to start on that), but to see if and how we can use the service to programmatically send alerts to administrators on their mobile devices. But before we do so, we need to use the web or desktop apps to do some initial configuration. So let’s get to it.


Setting Up Microsoft Teams
The first step to configuring Microsoft Teams is to login to https://teams.microsoft.com, select Teams and create our first team by clicking on Create team:
 
Next we give our new team a name and a description (optional). If we are currently the owner of an Office 365 Group, we get the option to add Teams functionality to that group:
 
The final step (optional) is to add one or more members to our new team:
 
If we add users, each will receive an email notifying them they have been added to our new Messaging Team:

 
We now have our first Team created :)

 
Each Team can have multiple channels. Channels are how Microsoft Teams organizes conversations. We can set up our channels however we like: by topic, discipline, project, and so on. Channels are open to everyone on the team and contain their own files, OneNote, etc...

So let’s create one channel just for alerts by clicking on ... next to our team’s name and then Add channel:
 
Give the channel a name and click Add:

We now have our Alerts channel dedicated to Exchange alerts:
 

Configuring WebHook Connector
Office 365 Connectors are used to get information and content into Microsoft Teams. Any user can connect their team to services like Trello, GitHub, Bing News, Twitter, etc., and get notified of the team's activity in that service. Connectors also provide a way for developers to integrate with Microsoft Teams by building custom incoming WebHook Connectors to generate rich cards within channels.
To generate our alerts to administrators, we will create these cards (messages) by sending an HTTP request with a simple JavaScript Object Notation (JSON) payload to a Microsoft Teams webhook address.

First, we need to create a webhook address for our Alerts channel:
1. From within Microsoft Teams, click ... next to the channel name and then select Connectors:
 
2. Scroll through the list of connectors to Incoming Webhook, and click Add:
  
3. Enter a name for the webhook, upload an image to associate with data from the webhook (optional), and select Create:
  
4. Copy the webhook URL to the clipboard and save it. We will need this URL for sending information to our channel:
 
 5. Click Done and a message will be visible in the Conversations tab informing all members that an incoming webhook has been configured for the channel:

 
We now have our webhook configured which we will use to post messages to our Alert channel. If we go into Connectors one more time, we are informed that an Incoming Webhook is already configured and by whom. If we click on Manage we get the options to change its name (which I have changed to AlertsBot) and to remove the webhook.
 
Please be aware that any member of the team can get the webhook URL and use it to send messages. On top of that, any member can also remove the webhook...

 
Sending Messages to Microsoft Teams
Now that we have our webhook configured, we need a method to send an HTTP request with a JSON payload to the webhook address. To achieve this, we have two options. The first option is to use cURL, a tool used in command lines or scripts to transfer data with URLs. Since my workstation is 64-bit, I downloaded the Win64 - Generic version (at the time of writing this blog, v7.51.0).
 
From the command line (not PowerShell), we can use the following command to send a basic “Hello World!” message to our channel:
curl.exe -H “Content-Type: application/json” -d “{\”text\”: \”Hello World!\”}”

If the POST succeeds, we will get a simple 1 returned by cURL:
 
If we go back to our channel’s Conversation window, we can see the new card posted to the team:
 
Our first programmatic alert/message to Microsoft Teams! :-D


Doing the same using PowerShell and cURL is a bit more tricky because of the “ (quotes) within the code. In the example above we used \” to escape the quotes, which will not work with PowerShell. The easiest method I found was to put the whole payload in a file (let’s call it alert.json, but we can also use alert.txt for example) and then pass the file into cURL. The file will look like this:
 
And the code used will be the following:
$webHook = “https://outlook.office365.com/webhook/bcbc68a4-606f-4ebf-8d78-4bbeac2c0c96@ed835685-e329-4799-9a9e-7ec941c92287/IncomingWebhook/(...)"

.\curl.exe -H “Content-Type: application/json” -d “@alert.json” $webHook


The second option to send messages to Microsoft Teams (and a much easier one!), is to simply use PowerShell’s native capabilities with the following two cmdlets:
Invoke-RestMethod: sends HTTP/HTTPS requests to Representational State Transfer (REST) web services;
ConvertTo-Json: converts any object to a string in JSON format. The properties are converted to field names, the field values are converted to property values, and the methods are removed.


Using these two cmdlets, we don’t need cURL anymore. Our previous “Hello World!” example becomes simply the following:

$webHook = “https://outlook.office365.com/webhook/bcbc68a4-606f-4ebf-8d78-4bbeac2c0c96@ed835685-e329-4799-9a9e-7ec941c92287/IncomingWebhook/(...)”

$alert = ConvertTo-JSON @{
text = “Hello World!”
}

Invoke-RestMethod -ContentType “application/json” -Method Post -body $alert -Uri $webHook

Simple as that! :)

If we manually run the code just to see what the variable $alert contains, we will see that it is in the exact same (JSON) format as our alert.json file:
  
 
In our next example, we start to get live data from Exchange and report on it. This simple example just sends a message containing certain details about a mailbox database named MDB01:
$webHook = “https://outlook.office365.com/webhook/bcbc68a4-606f-4ebf-8d78-4bbeac2c0c96@ed835685-e329-4799-9a9e-7ec941c92287/IncomingWebhook/(...)”

$exchDB = Get-MailboxDatabase “MDB01” -Status | Select Name, LastFullBackup, DatabaseSize, Mounted, ServerName
$userCount = (Get-Mailbox -Database $exchDB.Name -ResultSize Unlimited).Count
$size = $($exchDB.DatabaseSize.Split(“(“)[0])

$alert = ConvertTo-Json -Depth 4 @{
  text = “**$($exchDB.Name) Information:**”
  sections = @(
    @{
      facts = @(
        @{
        name = "Database:"
        value = $exchDB.Name
        },
        @{
        name = "Last Bck:"
        value = $exchDB.LastFullBackup
        },
        @{
        name = "Size (GB):"
        value = $size
        },
        @{
        name = "Mounted?"
        value = $($exchDB.Mounted)
        },
        @{
        name = "On Server:"
        value = $exchDB.ServerName
        },
        @{
        name = "User Count:"
        value = $userCount
        }
      )
    }
  )
}

Invoke-RestMethod -ContentType "application/json" -Method Post -body $alert -Uri $webHook

The result will be all the details for MDB01 nicely formatted:
 
 
Let’s now look at how we could monitor Exchange’s transport queues and issue an alert if the total number of queued emails goes beyond a certain limit. To achieve this, we get the queues across all servers, exclude any Shadow Redundancy emails, and count the total number of emails across the queues. Then, if that number is above our limit, we send an alert. Obviously, this is a basic script just for demonstration purposes. In a production environment, a few tweaks would likely be required, such as the threshold limit, any queues or servers to include/exclude, use a scheduled task instead perhaps, and so on.
$webHook = “https://outlook.office365.com/webhook/bcbc68a4-606f-4ebf-8d78-4bbeac2c0c96@ed835685-e329-4799-9a9e-7ec941c92287/IncomingWebhook/(...)”

While ($True) {
[Int] $msgCount = 0
Get-TransportService | Get-Queue | Where {$_.MessageCount -gt 0 -and $_.DeliveryType -notlike "Shadow*"} | ForEach {$msgCount += $_.MessageCount}

If ($msgCount -gt 50) {
$alert = ConvertTo-Json -Depth 1 @{
text = “**High Mail Queues!**`nTotal queued emails: $msgCount”
}

Invoke-RestMethod -ContentType "application/json" -Method Post -body $alert -Uri $webHook
}
Start-Sleep –Seconds 1800
}

The result will be the following alert:
  
 
Microsoft Teams Mobile Client
The purpose of this post was not to test Microsoft Teams itself, but to test if it can be used to reliably alert administrators on their mobile devices with any potential issues with Exchange.

We already established that we can easily generate alerts to a Teams’ channel, but what we now need to test is Microsoft Teams’ mobile app. To show how platform-independent Microsoft Teams is, I am going to use an iPhone to test the mobile app (trust me, I am not an Apple fan) :)

We start by searching and downloading the app from the Apple Store:
  
Once we open the app for the first time, we are asked to sign in:
  
After signing in we are presented with four tips, the last one being about notifications, which for the purpose of this article, we should obviously enable:

  
Once we sign in we can easily see the message we previously sent:
 
  
According to Microsoft, the best way to make sure people see our message is to @mention them. We do this by typing @ before a name and choosing the person we want to mention from the picker. They will generate a notification and a number will appear next to the channel we mentioned them in. When we mention someone, no one else will receive a notification, but everyone in the team will be able to see that we @mentioned someone though. Alternatively, we can also mention the entire channel, which will make everyone receive a notification.

At this stage it seems that I only get an alert on my mobile phone when someone mentions me:
  
Notice my name highlighted in red and the “@” at the top right hand corner of the message:
 
 
So, I had a look at the Notification configuration in the app and found the following:
 
 
I was hoping that by enabling everything I would start getting a notification on my phone for everything, but this was not the case. I still don’t get an alert unless someone mentions me, or the entire channel, sends me a direct message, replies to a message of mine or likes something I posted.

The problem is that I haven’t been able to find a way of mentioning someone or a channel using cURL or PowerShell... :( This means that users will get the messages on their mobile devices but not a notification, making this method not suitable for what I am trying to achieve... This, of course, until I find a way of mentioning someone using JSON!

I found an article on Bot Builder for .NET that has a section about Activities and Mention Entities. This article states that we can mention someone using a JSON like this:

{   
  ...
  "entities": [{ 
    "type":"mention",
    "mentioned": { 
      "id": "UV341235", "name":"Color Bot"
    },
    "text": "@ColorBot"
  }]
  ...
}


But I still haven’t been able to make it work using PowerShell (or any other method for that matter!)...

So using both the web and desktop Team apps, I sent a few messages where I mentioned someone and captured the JSON payload to see exactly how these are constructed and sent. For example, the following message:
  
Translates into the following JSON:
 
So it should just be a matter of building an identical (except maybe for the ClientMessageID property) JSON, right? Nope... Unfortunately, even sending an identical JSON using PowerShell results in the exact same message but without the mention...


Conclusion
Surely I am missing something here because of my lack of JSON knowledge and experience... As such, it might be that adding or changing something really simple will make it work! As is, I can’t yet use Teams to reliably alert me until I figure how to mention someone...

Nonetheless, Microsoft Teams is an awesome product and I am looking forward to explore it even further!

Thursday, October 13, 2016

Exchange alerting using Slack

In the Exchange monitoring concerns? Pick up the Slack article at TechGenix, I explore how to use Slack to send alerts to administrators’ mobile devices when something is wrong with Exchange.
 
 
A company’s messaging infrastructure is typically one of its most critical systems. Every administrator knows the importance of continuously monitoring Exchange. This is not only to prevent downtime and quickly fix problems, but also to be aware of the health of the infrastructure, to help identify potential problems, and spot performance degradations before they turn into actual problems and cause downtime.

Monitoring solutions such as Microsoft’s System Center Operations Manager (SCOM), SolarWinds, Nagios, and MailScape are some examples of monitoring tools for Exchange. However, not every organization has the means and capabilities to acquire and use them. On top of that, many monitoring solutions alert administrators exclusively by email, which can be problematic if the mail flow itself is affected, or through a dashboard that administrators might not have access to outside business hours.

Throughout my career, I have developed several scripts that run continuously every x minutes, and if they detect something is wrong with Exchange, they send an email alert. There are, however, two issues with this approach:
  1. If mail flow is affected, as already mentioned, then administrators will not receive the email alert.
  2. When out of the office, not everyone is constantly checking their emails, meaning it might be a while until an administrator is made aware something is wrong.
 
 
For these reasons, I researched the best methods to send notifications to my phone when something was wrong with Exchange. I tried Mobile Device Management (MDM) solution we were using at the time, but it seemed there was no way to interact with its API in order to send alerts programmatically. An alternative I also considered was WhatsApp. Although it is possible to use PowerShell to send WhatsApp notifications, it has a few drawbacks, such as the need for the recipients to register with a service like WhatsMate WA Gateway and the fact that I would need to maintain a list of users who would like to receive the notifications on my scripts. Users wouldn’t be able to opt-in or opt-out from receiving notifications themselves.

Slack to the rescue
Slack is a messaging app for teams that is even used by the NASA team behind the Mars Curiosity Rover. Slack is becoming extremely popular, and I am starting to see why. Just have a quick look at the video below and judge for yourself.

To continue reading, please check the Exchange monitoring concerns? Pick up the Slack article at TechGenix where I explore how to use Slack to send alerts to administrators’ mobile devices when something is wrong with Exchange.
 

Wednesday, May 18, 2016

Remote Exchange Monitoring and Reporting using Email

We all know how crucial a messaging service is to most organizations. With the exception of maybe telephones, businesses today rely on email and messaging systems more than any other piece of infrastructure. Every Exchange administrator knows the importance of continuously monitoring Exchange, not only to prevent downtime and quickly fix problems after they occur, but also to be aware of the health of the infrastructure and to help identify potential problems and performance degradations before they turn into problems and cause downtime.

Monitoring solutions like Microsoft’s System Center Operations Manager, SolarWinds, Nagios, MailScape, etc., are just some examples of monitoring tools for Exchange. However, some organizations do not provide access to these tool’s consoles or dashboards outside the internal network. So what happens if an administrator is out and about without anything other than his/her phone and needs to check if this user has gone over their quota and cannot send emails, on which server a particular database is mounted, or even if ServerA has just been rebooted?

These type of situations might be rare, but I have personally been there and it would have been extremely useful if I could send an email to my mailbox with a particular PowerShell cmdlet and get the output of that cmdlet back. And this is what this article is about. We will develop two basic scripts that will monitor incoming emails between two users (for security reasons), run the cmdlet(s) in the email’s subject and reply with the output from that same cmdlet. The first script will use Message Tracking Logs while the second Exchange Web Services (EWS).

To continue reading, please check this article at MSExchange.org.


Saturday, April 23, 2016

Monitor Mailbox Database Transaction Logs

Excessive database and/or transaction log growth is, unfortunately, not an uncommon problem in Exchange deployments. On top of being hard to troubleshoot, if it is found too late, it can cause serious issues for users and even the business. As such, it is crucial to have an adequate monitoring solution. However, this is not the case in every single organization, so I decided to write a basic script to keep an eye on the number of logs being generated across databases.
 
You can, for example, run the script every hour and if any database currently has more logs than a specified threshold, it sends an alert by email with the number of transaction logs for all databases, highlighting the one(s) that triggered the alert, and the current free space for the database (you might need to update it depending on whether you have the .edb file and logs on the same or different locations).
 
The script simply counts all files in the LogFolderPath location (variable for each database) as this makes it quicker than only looking for *.log files, and still be accurate for what we want to achieve.

You can download the complete final script from the TechNet Script Gallery.

Thursday, April 21, 2016

Mailbox Database Seed Status

Seeding large mailbox databases can potentially take a long time. Although it is something that usually does not need to be monitored, it is always good to keep an eye on it to see how it is doing. The Get-MailboxDatabaseCopyStatus cmdlet gives us all the information we need for this.

Usually I use this cmdlet in the following format to ensure the mailbox database copies on a particular server are mounted and/or healthy:
Get-MailboxDatabaseCopyStatus -Server "server_name" | Sort Name


But we can use it to get further details for a particular mailbox databases (the following output has been shortened to only include the most relevant information for this tip):

[PS] C:\>Get-MailboxDatabaseCopyStatus “MDB01\EXAIO” | FL

Identity : MDB01\EXAIO
DatabaseName : MDB01
Status : Seeding
MailboxServer : EXAIO
ActiveDatabaseCopy : EXMBX01
ActiveCopy : False
ActivationPreference : 3
IsLastCopyAvailabilityChecksPassed : False
LastCopyAvailabilityChecksPassedTime :
IsLastCopyRedundancyChecksPassed : False
LastCopyRedundancyChecksPassedTime :
ActivationSuspended : True
ContentIndexState : FailedAndSuspended
ContentIndexErrorMessage : Reseeding of the index is required.
ContentIndexErrorCode : 22
CopyQueueLength : 718053
ReplayQueueLength : 0
ReplicationIsInBlockMode : False
ActivationDisabledAndMoveNow : False
AutoActivationPolicy : Unrestricted
ReplayLagStatus : Enabled:False; PlayDownReason:None; Percentage:0; Configured:00:00:00;
Actual:00:00:00
DatabaseSeedStatus : Percentage:33; Read:95.19 GB; Written:95.19 GB; ReadPerSec:23.65 MB; WrittenPerSec:23.67 MB

DiskFreeSpacePercent : 60
DiskFreeSpace : 434.7 GB (466,730,405,888 bytes)
DiskTotalSpace : 717 GB (769,869,737,984 bytes)
DatabaseVolumeMountPoint : E:\Mount\edb09\
LogVolumeMountPoint : E:\Mount\edb09\


If we are particularly interested on the progress of the seed operation, we can filter the above output to only include what we want:
(Get-MailboxDatabaseCopyStatus “MDB01\EXAIO”).DatabaseSeedStatus

Monday, February 22, 2016

ExMon for Exchange 2013/2016 Now Available

ExMon, also known as Microsoft Exchange Server User Monitor, has finally been updated for Exchange 2013 and 2016!

You can download the installation file here, as well as a PDF how-to guide on how to use ExMon.

Wednesday, September 10, 2014

Managed Availability Failed by Design Error

If you navigate to the Exchange’s ProbeResult Crimson Channel under ActiveMonitoring, you will likely find the following error event logged:


EventID: 2
Channel: Microsoft-Exchange-ActiveMonitoring/ProbeResult
ResultId: 479968430
ServiceName: Monitoring
ResultName: HealthManagerHeartbeatProbe
Error:  Failed by design.
Exception: System.Exception: Failed by design. at Microsoft.Office.Datacenter.ActiveMonitoring.TestActiveMonitoringProbe.DoWork(CancellationToken cancellationToken) at Microsoft.Office.Datacenter.WorkerTaskFramework.WorkItem.Execute(CancellationToken joinedToken) at Microsoft.Office.Datacenter.WorkerTaskFramework.WorkItem. c__DisplayClass2.startexecuting b__0() at System.Threading.Tasks.Task.Execute()

So why is something failing by design?! Basically this probe is testing the Managed Availability framework, including that it can run responders. More specifically, a probe that will test that monitors can become unhealthy and execute null responders.

Bottom line, nothing to worry about :)

Sunday, August 4, 2013

Error Deleting Database "Failed to remove monitoring mailbox object"

When removing databases from Exchange 2013, you might get the following error if the correct procedures are not followed:
Failed to remove monitoring mailbox object of database “database_name”. Exception: Active directory operation failed on “server_name”. This error is not retrievable. Additional information: Access is denied. Active directory response: 000000005: SecErr: DSID-031520B2, problem 4003 (INSUFF_ACCESS_RIGHTS), data 0.


In this case, the database was removed an Active Directory [AD] error (with a not very useful description) complaining about insufficient permissions is thrown. If you run:
Get-Mailbox -Monitoring

You will most likely see a warning regarding a corrupted Health Mailbox:
WARNING: The object “domain_name”/Microsoft Exchange System Objects/Monitoring Mailboxes/”Health_Mailbox_GUID” has been corrupted, and it's in an inconsistent state. The following validation errors happened: WARNING: Database is mandatory or UserMailbox.


Because Exchange 2013 did not have sufficient permissions to the domainname/Microsoft Exchange System Objects/Monitoring Mailboxes Organizational Unit [OU], it could not delete the AD objects related to the database’s health mailboxes. In this case, the database attribute is null because the database the health mailbox references no longer exists.

To fix this issue, simply delete the health mailboxes referenced by the error(s) from that OU by using Active Directory Users and Computers. After removing these, the warning should be gone.


Deleting health mailboxes is a low risk procedure because they will be automatically re-created by the Microsoft Exchange Health Manager service on the Exchange 2013 server hosting the database when this service is restarted.

Wednesday, May 15, 2013

Exchange 2013 Management Pack

The Exchange team has just released the Exchange 2013 Management Pack! You can find the Management Pack here and the guide here. The guide walks through the details of deploying, configuring and using the Management Pack.
 
Prerequisites
Before you can import the management pack, verify that the following conditions are met:
  • You have one of the following versions of System Center Operations Manager deployed in your organization:
        o System Center Operations Manager 2012 RTM or later
        o System Center Operations Manager 2007 R2 or later
  • You have already deployed SCOM agents to your Exchange Servers. Show me how.
  • The SCOM agents on your Exchange Servers are running under the local system account. Show me how.
  • The SCOM agents on your Exchange Servers are configured to act as a proxy and discover managed objects on other computers. Show me how.
  • Your user account is a member of the Operations Manager Administrators role.
 
Management Pack Scope and Benefits
The Exchange team takes monitoring seriously, and they have created a pretty comprehensive Management Pack in terms of monitoring coverage, with the primary focus being reduced downtime for an Exchange environment.
 
The Management Pack contains about 75 monitors that cover Exchange component health (such as Hub Transport health), customer touch point health (such as “is OWA working”), clustered scenarios, as well as dependencies monitoring (“is Active Directory healthy”). Monitoring covers primarily availability and performance scenarios.
 
The Exchange 2013 product comes with monitoring “built in” (more on that below). This means that Exchange itself has means to detect and try to automatically recover from availability and performance issues, before an operator is notified. This means reduced alert noise, as well as reduced administrative overhead for the Exchange product itself. In concrete terms, an Exchange server may detect an issue, then try for some time to fix it automatically. Only after the automatic recovery attempts have failed is the operator notified via an alert.
 
What’s in the Management Pack?
The Management Pack is very simple. It contains a handful of classes, 3 views, and about 75 monitors described here
. There are also some dependency monitors.
 
All the monitors are simple event-based monitors using events in the Microsoft-Exchange-ManagedAvailability/Monitoring event log, logged by each Exchange server. So, each Exchange server is responsible for monitoring itself and its health.
 
In terms of scalability, this means this Management Pack will have a low impact to your Operations Manager environment. You will not require a separate Management Group for this MP for scalability purposes.
 
Where are the monitors?
If you look at the Management Pack in some tool like MP Viewer, you will discover that there are not 75 monitors in the Management Pack. This is because the Management Pack has logic to dynamically determine the set of monitors by communicating with the built-in monitoring features of Exchange (more on that below). The way to see the monitors is by installing the Management Pack in an Operations Manager environment with monitored Exchange servers and using Health Explorer (you can also see them listed in the Management Pack Guide).
 
What’s not in the Management Pack?
If you are familiar with the Exchange 2010 Management Pack, you know that it had a service called the correlation engine that ran on the Root Management Server. It basically correlated health data from all monitored Exchange components. In the Exchange 2013 Management Pack, the correlation engine is no longer used. Each monitored Exchange server is responsible for monitoring its own health, and simply reports this via the Operations Manager agent. There is a little bit of roll-up going on, from Exchange server to Organization health. There are no special components running on the Operations Manager Management Servers.
 
The Exchange 2010 Management Pack had tens of classes, leading to a pretty complex health model and many object instances being created. The Exchange 2013 Management Pack is very simple. It has only a few classes and should have a very low impact on Operations Manager in terms of instance space.
 
There are no performance counters collected by this Management Pack (as mentioned above, the monitoring does cover performance scenarios). However, all Exchange PerfMon counters are still available. It should be simple to create your own performance collection rules, if you do require them.
 
This means that by default there is way less pressure on the Management Group compared to the Exchange 2010 Management Pack, since there are no performance counters to store. But, what about reporting? There are also no reports in this Management Pack. However, you can use some of the built-in Operations Manager reports (such as the Health report) to track organization availability, or define SLAs against the Organization.
 
How does the Management Pack work?
Exchange 2013 has a built in monitoring engine called Managed Availability. It runs on every Exchange server. It contains logic for how to determine Exchange health. It detects issues, automatically performs recoveries (Exchange calls these “responders”) and ultimately notifies operators of issues, if the recoveries were not successful. The purpose of this of course, is high availability. Managed Availability is explained in more detail here
.
 
 
Notification/Alerting to Operations Manager is handled via events, so the Management Pack has a set of simple event monitors that trigger based on these events. Events are logged to the Microsoft-Exchange-ManagedAvailability/Monitoring event log.
 
  • Probes: these are sets of data collectors that measure various components. There are three distinct types of probes:
      o Synthetic transactions that measure synthetic end-to-end user operations and checks that measure actual traffic;
      o Checks that measure actual customer traffic;
      o Notifications that allow Exchange to take immediate action. A good example of this is the notification that is triggered when a certificate expires.
  • Monitors: the data collected by probes are passed on to monitors that analyze the data for specific conditions and depending on those conditions determine if the particular component is healthy or unhealthy;
  • Responders: if a monitor determines that a component is unhealthy, it will trigger a responder. If the problem is recoverable, the responder attempts to recover the component using the built-in logic. There are several responders available for each component, but the one responder that’s relevant for the Exchange 2013 Management Pack is the Escalate Responder. When the Escalate Responder is triggered, it generates an event that the Exchange 2013 Management Pack recognizes and feeds the appropriate information into that alert that provides administrators with the information necessary to address the problem.

Each component in Exchange 2013 uses a specific set of probes, monitors and responders to monitor itself. These collections of probes and monitors are referred to as health sets. For example, there are a number of probes that collect data about various aspects of the ActiveSync service. This data is processed by a designated set of monitors that trigger the appropriate responders to correct any issues that they detect in the ActiveSync service. Collectively, these components make up the ActiveSync health set.

How should I work with this Management Pack?
First of all, this Management Pack should be simple to implement from an Operations Manager perspective. There are no special components to install on Management Servers, you do not need to worry about the impact to the Management Group in terms of database size, instance space, Management Server workload etc. You should be fine just importing this MP into your existing environment also for large Exchange deployments (as usual, we do recommend gradual deployment just in case). The Management Pack Guide includes a chapter on deployment, as usual you will need to enable Agent Proxy when you install the Operations Manager agents on Exchange 2013 servers.
 
Also, the Exchange team has been using the same monitoring logic in the Office365 environment. Normally, few changes to the Management Pack should be required.
 
If you want to disable some monitor, you can just create an override in Operations Manager as usual.
 
If you want to change a threshold for some monitor, this is done in the Exchange Managed Availability engine via PowerShell cmdlets. This does not involve Operations Manager at all. The Exchange Management Pack Guide walks through this scenario in some detail here. Since this kind of override is a modification of Exchange behavior, this kind of override is most commonly done by the Exchange administrator.
 
Also, Exchange Cumulative Updates may contain new or updated monitoring logic. These should be reviewed to determine the impact of that updated logic.
 
In terms of interoperability, this Management Pack does not upgrade the Exchange 2010 Management Pack, this is a completely new MP. It is possible to run these Management Packs side-by-side as you upgrade your Exchange environment from 2010 to 2013.
 
What’s the update mechanism for this Management Pack?The Managed Availability feature is built in to Exchange 2013. It contains the logic for how to detect issues and how to recover from them. The results of that is then reported to the event log for Operations Manager to pick up via event monitors. This means that updates in terms of Managed Availability monitors are shipped with Exchange Cumulative Updates.
As mentioned previously, the Exchange 2013 Management Pack has functionality to automatically detect these changes, so typically no Management Pack update is required.
 

Sources