For many years, all my PowerShell scripts kept a log of all their actions in a local file stored in the same folder where they ran, or in a file share so my colleagues could access the logs for troubleshooting. Nowadays, with some of those scripts running in Azure Automation, this is not really an option.
Some of these scripts in Azure Automation that don’t run too often, keep a monthly log in a SharePoint Online library. When they run, they download their current month’s log file locally (this is done using the Temp folder, $env:TEMP, which provides 1GB of temporary disk space while the runbook runs), do whatever they need to do while at the same time logging their actions against the local copy of the log file, and, once complete, upload the new log file to SharePoint overwriting the existing log.
However, for scripts that run very frequently, this might not be a suitable solution. For these, I tend to use a Log Analytics workspace where I log all the scripts’ actions. This is a great way to store logs because:
- It’s easy to write log entries in it;
- It’s easy to run queries against these logs using Kusto Query Language (KQL);
- We can retain the logs at no charge for up to 31 days (or 90 days if Microsoft Sentinel is enabled on the workspace), and with the Basic Logs we only pay £0.524 per GB in terms of ingestion;
- It’s easy to give my colleagues access to the logs.
For one particular solution I have, some of the users don’t have access to Log Analytics and wouldn’t really know how to use it if they did. As such, I started thinking about how to export these logs into CSV format so they could easily analyse them if needed. My first thought was to use another PowerShell runbook that would export these logs weekly or even monthly. If it’s easy to ingest logs into Log Analytics using its API, exporting them can’t be that hard. But then, why not use Power Automate or a Logic App to do this? It should be quicker to implement and, hopefully, less prone to issues/failures. After some research, I found the Azure Monitor Logs connector, which allows us to build workflows that retrieve data from a Log Analytics workspace or an Application Insights application in Azure Monitor!
This Azure Monitor Logs connector replaces the Azure Log Analytics connector and the Azure Application Insights connector. It provides the same functionality as the others and is now the recommended connector for these queries.
Connector Limits
Before we start configuring our workflow, it’s important to keep in mind the following connector limits:
- Max query response size: ~16.7 MB (16 MiB);
- Max number of records: 500,000;
- Max connector timeout: 110 seconds;
- Max query timeout: 100 seconds;
- Visualisations in the Logs page and the connector use different charting libraries and some functionality isn't available in the connector currently.
The connector may reach these limits depending on the query you use and the size of the results. If that happens, you must adjust the workflow recurrence to run more frequently and/or with a smaller time range.
Actions
As to the connector actions, it can perform two things:
- Run query and list results returns each row as its own object. We can use this action when we want to work with each row separately, or when we want to export the logs to CSV format, for example. This is the one I will be using;
- Run query and visualize results returns an HTML table, a pie chart, time chart, or a bar chart depicting the query result set.
Logic App
First, we need to define our trigger. In my case, I will be exporting the logs once a week. As such, under, Start with a common trigger, I select Recurrence:
As I will be running this workflow every Monday morning at 7:00, I configure my trigger like this:
Since I want to search and export Log Analytics logs for the past 7 days, I create two variables that define the start and end of my search. The start will be last Monday (inclusive, meaning >=) and the end will be when the workflow runs, which is also a Monday (but this time, excluding the current day, or <). Each variable is defined as follows:
- SearchStart: formatDateTime(addDays(utcNow(), -7), 'MM/dd/yyyy')
- SearchEnd: formatDateTime(utcNow(), 'MM/dd/yyyy')
Every time I create a new Power Automate flow or Logic App workflow, I like testing every step as I go along creating them. I believe this makes it easier to ensure everything works as expected and reduce the time troubleshooting any possible issues down the line. So, let’s see what we have so far:
As we can see, SearchStart is the Monday from one week ago, and SearchEnd is today, also a Monday. All good so far!
Next, we click on + New step, search for the Azure Monitor Logs action, and select Run query and list results:
We need to select the Subscription, Resource Group, Resource Type, and Resource Name for our Log Analytics workspace. As to the search query, I will be using the query below that searches the logs using the two variables we created earlier. Notice the >= and < used in the search, which allow us to search from Monday to Monday without duplicating results during each export.
As to Time Range, we need to set this to a value equal or higher than the amount of time we are searching our logs. In this example, I am searching for 7 days’ worth of logs, so I could set this to Last 8 days. However, because we are defining our time range in the query itself, we can simply set this to Set in query.
GlobalRelay_CL
| where DateTime_t >= datetime(@{variables('SearchStart')}) and DateTime_t < datetime(@{variables('SearchEnd')})
| sort by DateTime_t desc
| project DateTime_t, Type_s, Message
If we run our workflow at this stage, we can see that the query is correctly using our SearchStart and SearchEnd variables, and that we are getting log entries returned from Log Analytics! 😊
Now that we have our results, we use the Data Operations action to take the output from our search and create a CSV table:
The From is our data source which, in this case, is the value that gets passed from the Run query and list results action, so that’s what I select. As for Columns, we can leave it to Automatic as I don’t need to map them to a different column name for example.
If we test this step, we should see the log entries that we retrieved from Log Analytics previously, now in a CSV format instead of JSON:
Our final action is to save this data into an actual CSV file. In my case, this will be stored in a SharePoint library, so I search for the Create file SharePoint action:
Next, I specify the Site Address that will store the file, the Folder Path, the File Name, and the File Content. For the file name, I am using the following expression to dynamically generate a name based on the last date of logs the file contains, which is yesterday (Sunday). For the current example, the file will be named “LogExtract_20230319.csv”.
concat('LogExtract_', string(formatDateTime(addDays(utcNow(), -1), 'yyyyMMdd')), '.csv')
Lastly, the File Content is simply the Output from our Create CSV table action, so that’s what we select from Dynamic content:
Running a final test, we can see that the file was successfully created!
If I check our SharePoint library, the file is there with all the data I expected 😊
Error Checking
The workflow seems to work great, but it’s always good practice to include error-checking for any actions that might fail. For example, what if the workflow fails to retrieve the entries from Log Analytics for some reason? To account for this, we can go to our Run query and list results action, and add a parallel branch:
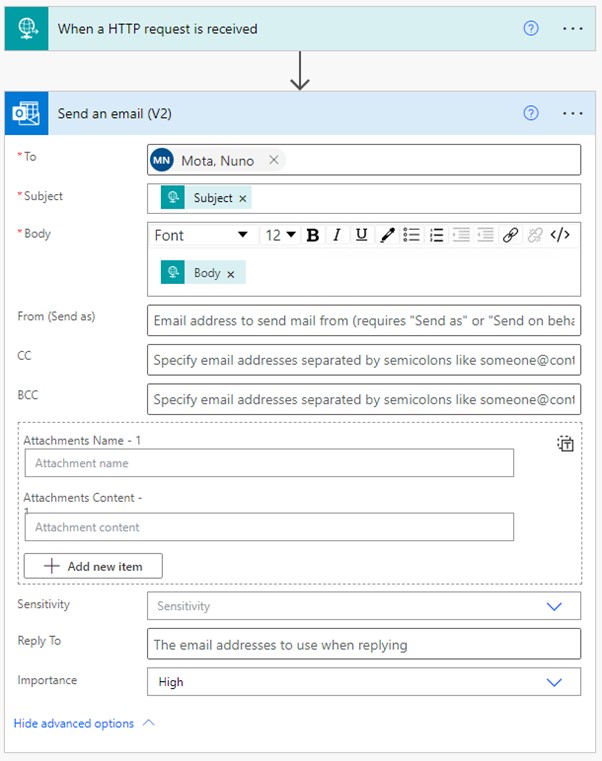
In this new branch, I will send myself an email stating the export has failed. This is just a basic example, and you should include as many details as possible regarding the error itself, the stage at which the workflow failed, etc.
The only thing left to do is to ensure this branch only runs in case of a failure. To do that, we click on the “...” next to our action title, select Configure run after, unselect is successful, and select has timed out and has failed:


